Correlating the saliency models with the human data
Each of the saliency models takes an image as input, and produces a saliency map as output. Such a saliency map gives the chance of a fixation for every point in the image. This saliency map is then correlated with a fixation distance map. This map uses the distance of a point in the image to the nearest fixation made by the participants. The fixation distance map has maximum values on the points where the participants made fixations. The minimum points are at the places where no human fixations are near. Figure 1 show the correlation results.
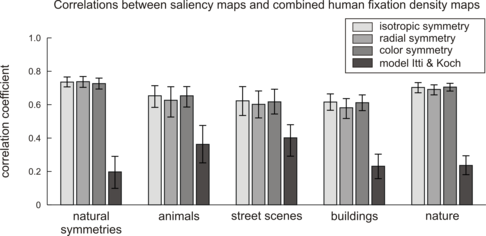
Figure 1: The results of the correlation between the human fixation data and the saliency models. The five different groups of bars give the data for the five different image categories. The bars give the mean correlation values, and the error bars show the 95% confidence intervals.
Figure 1 shows that the symmetry models correlate significantly better with the human data than the contrast saliency model of Itti and Koch. This shows that local symmetry guides eye movements and is therefore a salient feature. To view some of the images with their fixation distance maps and the response of the different saliency models, use the saliency inspector.